Will SatVu Thermal Imagery Unlock Data Centre Transparency?
SatVu has released a first-of-its-kind thermal image that reveals operational activity inside one of the largest crypto mining data centres in the US.
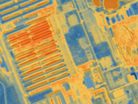
Captured at 3.5m resolution, the image focuses on a flagship facility in Rockdale, Texas and provides a heat-based view of how infrastructure within the site is actually being used.
The released image offers a new way to observe when data centre capacity comes online and how energy demand is distributed across large campuses.

The imagery arrives as demand for data centre capacity continues to rise, driven by AI, cloud computing and crypto mining.
These facilities rank among the most energy-intensive assets connected to power grids, yet external visibility into their real operational status often lags behind physical construction.
SatVu positions its thermal intelligence as an independent method of observing activity as it happens rather than relying on announcements or delayed reporting.
Thermal data captures operational reality
The thermal image highlights distinct heat signatures across rooftop cooling units, substations, transformers and electrical yards. These patterns show which parts of the data centre are active and which remain dormant.
Thermal data gives an objective view of operational activity as it occurs – not weeks later through reports or announcements
Rather than confirming whether a site is simply built, the imagery reveals how workloads and energy use are distributed across the campus.
By identifying active cooling systems and loaded electrical infrastructure, the data provides evidence of real operational behaviour. This includes whether new phases are ramping in line with expectations and how utilisation changes over time.
For large data centre developments that are delivered in stages, this level of detail offers insight into actual capacity deployment rather than planned capacity alone.
SatVu explains that its thermal intelligence combines wide-area coverage with fine detail. At a broader scale, it indicates whether an entire site is active or only specific zones.
At a closer level, it identifies which systems are under load. Together, these views form a practical picture of how large data centre sites evolve once connected to the grid.
Visibility for regulators and operators
This type of insight is increasingly relevant for a range of stakeholders. Grid operators and regulators seek clearer understanding of how major energy users affect local power systems.
Analysts track how quickly new capacity becomes operational and where growth is concentrating. Communities and policymakers are paying closer attention to the environmental footprint of digital infrastructure as data centre expansion accelerates.
Thermal imagery provides a way to answer these questions using physical indicators rather than projections.
Heat output from cooling and electrical systems reflects live energy consumption, offering a grounded view of how infrastructure interacts with surrounding grids.
This is particularly relevant for crypto mining facilities, where demand can scale rapidly and fluctuate depending on market conditions.
Thomas Cobti, VP Business Development at SatVu, says: “Today’s data centre buildout is moving incredibly quickly, and the world needs better ways to understand what’s actually happening on the ground. Thermal data gives an objective view of operational activity as it occurs – not weeks later through reports or announcements.”
SatVu notes that near-real-time thermal intelligence reduces uncertainty for those assessing data centre growth.
It enables comparison between announced capacity and actual operational behaviour, supporting more informed decisions around grid planning and infrastructure investment.
Context of rapid global expansion
The release of the image comes as global investment in data centre infrastructure continues to grow.
McKinsey estimates that more than US$7tn will be spent worldwide by 2030, with demand in the US increasing by 20% to 25% annually.
As new sites connect to power networks, concerns around grid strain, regional concentration and emissions intensity continue to rise.
SatVu’s approach focuses on observation rather than prediction. By capturing thermal output from space, the company provides an independent source of information that complements on-the-ground reporting.
For data centre operators, this type of visibility also highlights how facilities are perceived externally, particularly as scrutiny around energy use increases.
The Rockdale image demonstrates how thermal intelligence can move beyond abstract capacity figures and present measurable indicators of activity.
By showing which systems are active and when, the data offers a practical tool for understanding how large-scale data centres operate once they are live.
Company portals

Executives
Thomas Cobti
VP - Business Development & Strategic Partnerships